-
-
Notifications
You must be signed in to change notification settings - Fork 7.9k
Mplot3d masked surface #18114
New issue
Have a question about this project? Sign up for a free GitHub account to open an issue and contact its maintainers and the community.
By clicking “Sign up for GitHub”, you agree to our terms of service and privacy statement. We’ll occasionally send you account related emails.
Already on GitHub? Sign in to your account
Mplot3d masked surface #18114
Conversation
There was a problem hiding this comment.
Choose a reason for hiding this comment
The reason will be displayed to describe this comment to others. Learn more.
Thanks for opening the PR! I've added a couple of comments/questions, but this looks 👍 overall
| @@ -1559,8 +1559,8 @@ def plot_surface(self, X, Y, Z, *args, norm=None, vmin=None, | |||
| "Z contains NaN values. This may result in rendering " | |||
| "artifacts.") | |||
|
|
|||
| # TODO: Support masked arrays | |||
| X, Y, Z = np.broadcast_arrays(X, Y, Z) | |||
| mask = np.ma.getmaskarray(Z) | |||
There was a problem hiding this comment.
Choose a reason for hiding this comment
The reason will be displayed to describe this comment to others. Learn more.
What happens if X or Y have a mask? My guess is we should take the union of all the masks to compute an 'overall' mask here.
There was a problem hiding this comment.
Choose a reason for hiding this comment
The reason will be displayed to describe this comment to others. Learn more.
Good question, I see that pcolormesh doesn't accept masked X and Y values (but it looks like pcolor might). I've not tested contour but it looks like masks are ignored on X and Y values?
|
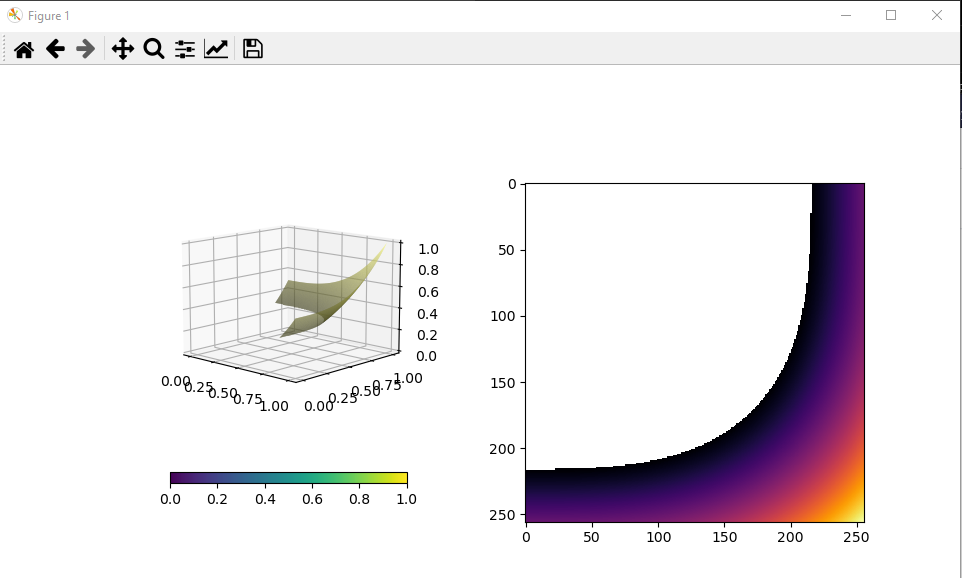
I would just like to mention: patching this PR with the following hack (easiest I can do is diff in shell code): ... will allow to also use facecolors, that would be "adjusted" to the masking of z; here is an example, that otherwise fails with this PR, with "ValueError: operands could not be broadcast together with shapes (22,1) (81,4)": import numpy as np
import matplotlib.pyplot as plt
dimsize = 256 # 10
x = np.linspace(0,1.0,dimsize)
y = np.linspace(0,1.0,dimsize)
xg,yg = np.meshgrid(x,y)
z = 0.5*(xg**3 + yg**3)
zcol = np.reshape( np.reshape(z, (-1,1))*np.array([1,1,0.5]), (z.shape[0], z.shape[1], 3) )
zm = np.ma.masked_array(z, z<0.3)
fig = plt.figure(figsize=(8, 8))
ax1 = fig.add_subplot(221, projection='3d')
ax2 = fig.add_subplot(222)
surf = ax1.plot_surface(xg,yg,zm,
rstride=1, cstride=1, linewidth=0,
facecolors=zcol
)
ax1.set_zlim(0,1)
plt.colorbar(surf, ax=ax1, shrink=0.7, orientation='horizontal')
ax2.imshow(zm, cmap='inferno')
plt.show()With the hack, this results with the following image: |
|
Is this still a viable PR? I'm not sure what still needs to be done here. @tomneep please feel free to ping us for reviews - things fall off the PR queue unfortunately. Thanks! |
|
Hi @jklymak, it was completely my fault, I got busy with other things. I'm happy to attempt to wrap this up. I've just pushed one change aiming to address one of the comments I received (and it simultaneously solves the problem raised by @sdbbs too). I'm a long way behind the master now, so lets see what the CI says. |
|
I had a quick look for related issues to this and #4941 is an interesting one. Before applying the changes in this branch, the example given there gives and with this branch I'd say that the fix gives what we'd want for masked data in 3D space, but the issue says they'd expect the masked data to be shown in red (the "bad" setting of the colormap). I'm not sure what the suggestion is here though, as if the area was present but red one would still be able to see the z values. I could do with some feedback on this. |
|
This is a conflict between what a mask means for the elevation, and what it means for the colormapping. Unfortunately those are the same thing for Its a bit awkward, but to get what is wanted in #4941 I think the user wants to colormap manually and pass in |
| @@ -1693,6 +1697,12 @@ def plot_surface(self, X, Y, Z, *args, norm=None, vmin=None, | |||
| cbook._array_perimeter(a[rs:rs_next+1, cs:cs_next+1]) | |||
| for a in (X, Y, Z) | |||
| ] | |||
| # If any of the perimeters are masked, then skip the | |||
There was a problem hiding this comment.
Choose a reason for hiding this comment
The reason will be displayed to describe this comment to others. Learn more.
Can you test this?
There was a problem hiding this comment.
Choose a reason for hiding this comment
The reason will be displayed to describe this comment to others. Learn more.
I've added another test for this based on the example above
There was a problem hiding this comment.
Choose a reason for hiding this comment
The reason will be displayed to describe this comment to others. Learn more.
Is this behavior desirable? If everything but the perimeter of the polygon is masked, do we really want to draw the polygon? Some other choices would be:
- Draw the polygon only if none of the contained elements are masked
- Draw the polygon if less than half (or a user-configurable parameter of the contained elements are masked
- Set the opacity of the polygon to be proportional to the maskedness
- Attempt to precisely outline the masked regions
Whatever you decide on, I think it's important to describe the choice in the docstring.
There was a problem hiding this comment.
Choose a reason for hiding this comment
The reason will be displayed to describe this comment to others. Learn more.
It is a good question and I'm happy to have more input on this topic.
My line of thought is that as long as the perimeters of the polygons don't contain masked data, then it is ok to draw the polygon. If some data inside of the polygon is masked but is strided over, then it is not used to make the plot anyway so we aren't "revealing" masked data in the plot. I understand this might cause a bit of confusion due to the nature of the xstride/xcount settings.
Draw the polygon if less than half (or a user-configurable parameter of the contained elements are masked
and
Set the opacity of the polygon to be proportional to the maskedness
These seem like "advanced" use cases to me but happy to hear if others think differently. Though I still don't think anyone would want the perimeter of a polygon to contain masked data. As far as I can tell, no one has requested this kind of feature before.
Attempt to precisely outline the masked regions
Probably the ideal solution, if any one has suggestions how the can be accomplished then I'm happy to hear them!
There was a problem hiding this comment.
Choose a reason for hiding this comment
The reason will be displayed to describe this comment to others. Learn more.
I think I want input from @ianthomas23 about how he handled masked data for the contouring functions. I think it would make sense to be consistent with those rules.
There was a problem hiding this comment.
Choose a reason for hiding this comment
The reason will be displayed to describe this comment to others. Learn more.
Of course, the concepts don't perfectly overlap because the contouring algorithms don't have a concept of striding, but I am still interested in his input.
There was a problem hiding this comment.
Choose a reason for hiding this comment
The reason will be displayed to describe this comment to others. Learn more.
I don't believe striding does anything other than a simple decimation at the moment? If so I don't see why it would do something fancy for a mask. You could easily have the same complaint about a sharp spike that gets strided over. If folks want to properly decimate their data they can do so before passing to mpl.
There was a problem hiding this comment.
Choose a reason for hiding this comment
The reason will be displayed to describe this comment to others. Learn more.
I don't believe striding does anything other than a simple decimation at the moment?
It doesn't decimate the space fully, as the perimeter is still drawn at full precision. But looking closely, the colormap color is computed based only on the perimeter, so I guess the implemented behavior is consistent.
Yes I completely agree with you. I'd say that what this PR does is the right thing to do and moves things in the right direction. |
There was a problem hiding this comment.
Choose a reason for hiding this comment
The reason will be displayed to describe this comment to others. Learn more.
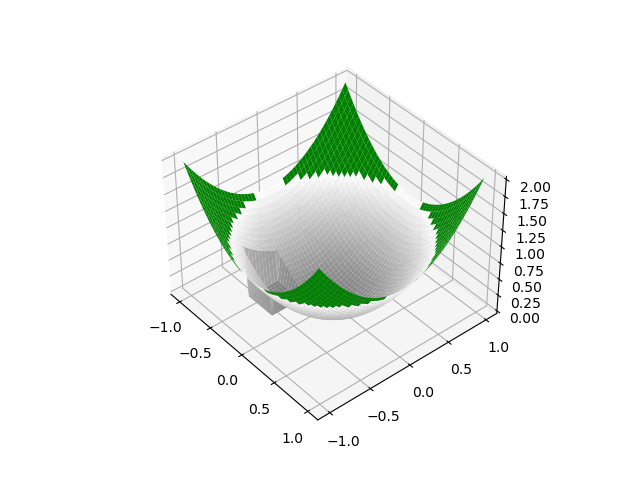
If you update the images and want to keep your other commits split apart when merged (instead of squash merged), please amend the commit with the image so that the old ones are not kept in the repo.
| Y = np.linspace(-1, 1) | ||
| X, Y = np.meshgrid(X, Y) | ||
| Z = X**2 + Y**2 | ||
| Z[10:20, 10:20] = 0.0 |
There was a problem hiding this comment.
Choose a reason for hiding this comment
The reason will be displayed to describe this comment to others. Learn more.
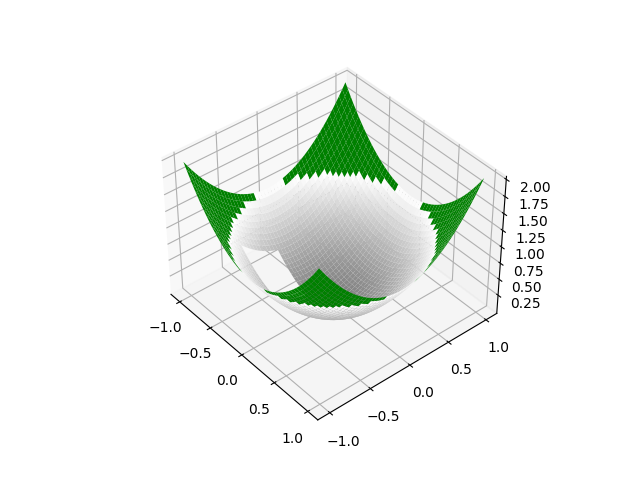
The location of the hole is a bit difficult to see; can you move it somewhere move visible?
There was a problem hiding this comment.
Choose a reason for hiding this comment
The reason will be displayed to describe this comment to others. Learn more.
Thanks for the suggestion. I've updated the image with the hole in a more prominent place. I amended the commit though I have no preference on whether this is squash merged or not.
|
Thanks for the reviews and discussion on this so far. During my investigations of this I think I've found a better way of addressing this, while fixing a few other open issues too. The approach is to allow NaNs in data passed to if isinstance(Z, np.ma.MaskedArray):
Z = Z.astype(float).filled(np.nan)somewhere in Of course, the big question is whether #20646 is viable? If so I think I can close this PR and move forwards with that |
|
Thanks for the ping @WeatherGod. To compare with import matplotlib.pyplot as plt
import numpy as np
x, y = np.meshgrid(np.arange(7), np.arange(10))
z = np.sin(0.5 * x) * np.cos(0.52 * y)
mask = np.zeros_like(z, dtype=bool)
mask[2, 3:5] = True
mask[3:5, 4] = True
mask[7, 2] = True
mask[5, 0] = True
mask[0, 6] = True
z = np.ma.array(z, mask=mask)
fig = plt.figure(figsize=(16, 4))
for i, corner_mask in enumerate([False, True]):
ax = fig.add_subplot(1, 3, i+1)
cs = ax.contourf(x, y, z, corner_mask=corner_mask)
fig.colorbar(cs, ax=ax)
ax.set_title('corner_mask = {0}'.format(corner_mask))
ax.grid(c='k', ls='-', alpha=0.3)
ax.plot(np.ma.array(x, mask=~mask), y, 'ro')
ax = fig.add_subplot(1, 3, 3, projection='3d')
ax.elev = 65
surf = ax.plot_surface(x, y, z, rstride=1, cstride=1, cmap='viridis')
fig.colorbar(surf, ax=ax)
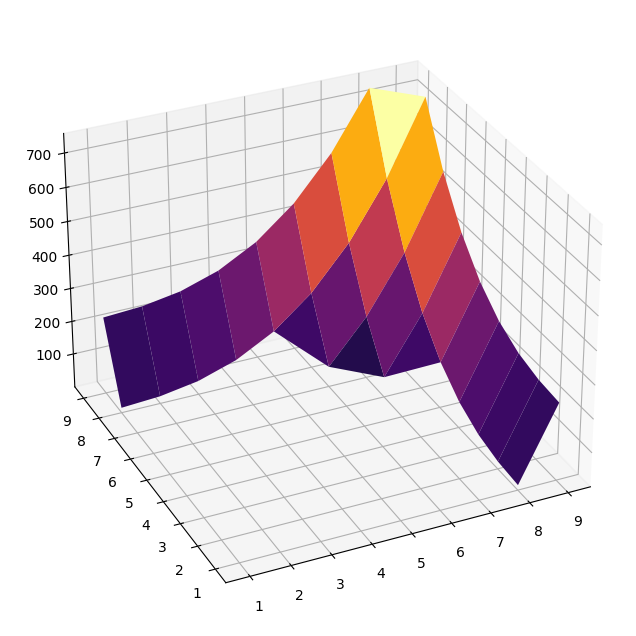
plt.show()Using the latest commit (3eace1e) from this PR the output is The approach of @tomneep's previous comment looks equivalent to |
|
I'll move this to draft while you sort out #20646, but feel free to move back if you think they can be looked at independently. |
|
Replaced by #20725, I believe. |


PR Summary
This allows
np.ma.MaskedArrayto be used as the data inplot_surface().I expect that the solution is the same as the one proposed in #487.
The colormap min/max is normalised to the data that is shown in the plot, as is the zlim.
Demo
Taking an example inspired by that of #487 produces the following
PR Checklist