-
-
Notifications
You must be signed in to change notification settings - Fork 7.9k
Closed
Labels
Release criticalFor bugs that make the library unusable (segfaults, incorrect plots, etc) and major regressions.For bugs that make the library unusable (segfaults, incorrect plots, etc) and major regressions.
Milestone
Description
Bug report
Bug summary
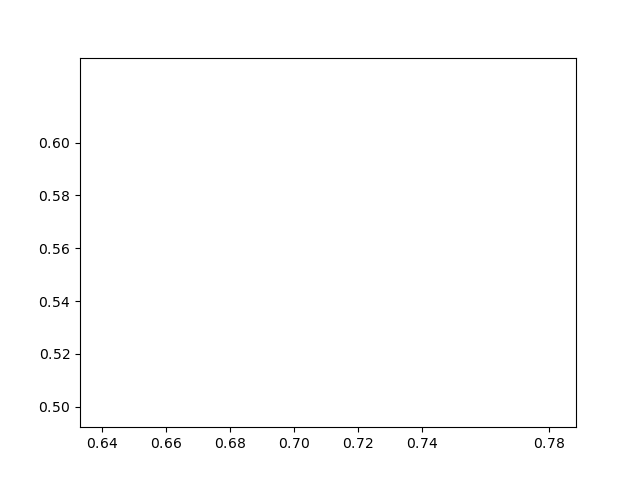
Starting from an empty plot (plot()), after alternating a couple of times of zooming interactively and clicking on the "back" button, some ticks disappear. Sorry, I don't have a proper reproducer right now, will investigate.
Code for reproduction
tbd
Actual outcome
Expected outcome
Matplotlib version
- Operating system: fedora
- Matplotlib version: master
- Matplotlib backend (
print(matplotlib.get_backend())): qt5agg - Python version: 37
- Jupyter version (if applicable): no
- Other libraries: no (
python -c "from pylab import *; plot(); show()")
I'm not actually sure it's a regression in master (not so easy to bisect without a consistent reproducer :)), but it looks like one and it'd be a pity to release 3.1 with this bug, so tentatively marking as RC...
Metadata
Metadata
Assignees
Labels
Release criticalFor bugs that make the library unusable (segfaults, incorrect plots, etc) and major regressions.For bugs that make the library unusable (segfaults, incorrect plots, etc) and major regressions.
