Missing stopwatch component gives inaccurate message in profiler #31056
Description
Symfony version(s) affected: 3.4+
Description
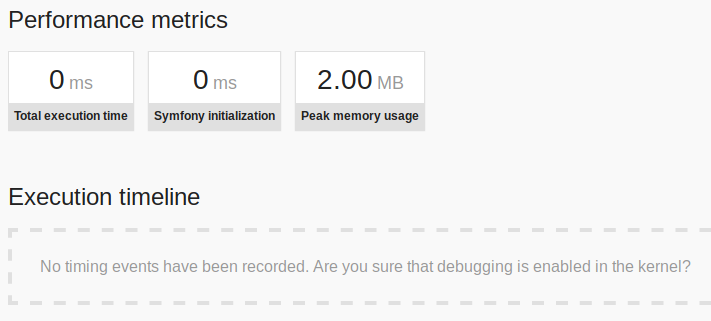
When you are missing the stopwatch component, you can't see the timings in the webdeveloper toolbar. When you navigate through the WDT via the "n/a" timings, you will arrive at a page saying: "No timing events have been recorded. Are you sure that debugging is enabled in the kernel?". While this message is a good hint, my application is running in debug, so it's only one of a few cases. Luckily I knew a missing stopwatch could cause missing timings, but I can imagine this to be very difficult to find for a developer with less Symfony experience.
How to reproduce
- Ensure the stopwatch component is not installed (no indirect dependencies either).
- Ensure your application is running in debug
- Load a page and verify the timing is saying "n/a":
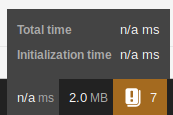
- Open this specific WDT link
- You will see the following:


Possible Solution
I think the easiest solution would be to detect whether or not the stopwatch component is installed. If not, pass that information to the collected data, so we can show a different message:
# TimeDataCollector would look like this
use Symfony\Component\Stopwatch\Stopwatch;

$this->data = [
    'token' => $response->headers->get('X-Debug-Token'),
    'start_time' => $startTime * 1000,
    'events' => [],
    'stopwatch_installed' => class_exists(Stopwatch::class, false),
];
{% if not collector.stopwatch_installed %}
<div class="empty">
<p>The stopwatch component is not installed. If you want to see timing events, run <code>composer require symfony/stopwatch</code></p>.
</div>
{% else if collector.events is empty %}
<div class="empty">
<p>No timing events have been recorded. Are you sure that debugging is enabled in the kernel?</p>
</div>
{% else %}
{{ block('panelContent') }}
{% endif %}Additional context
Current location of the template code triggered: