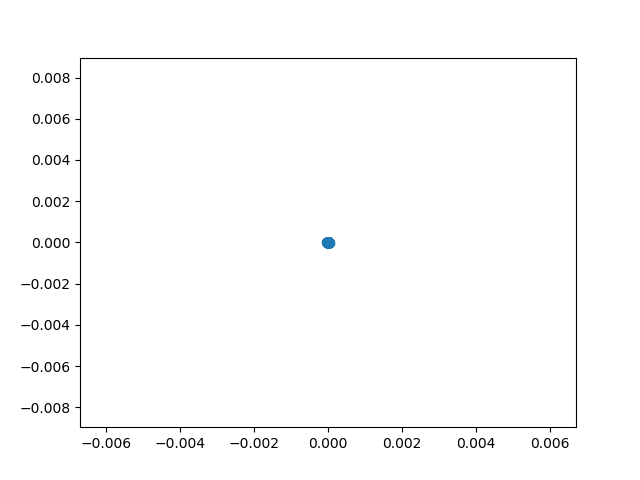
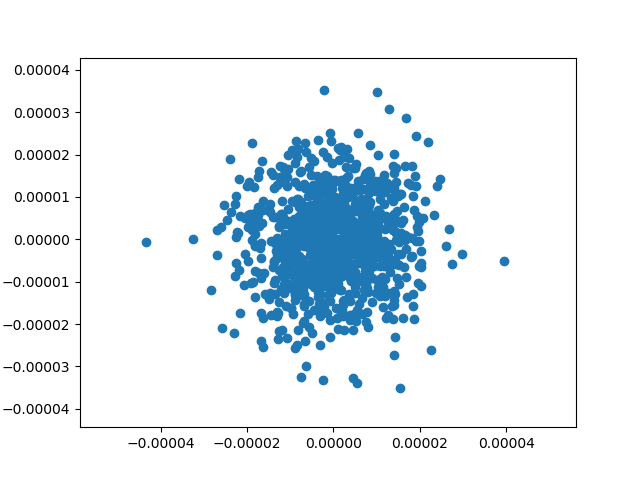
I'm not sure if this is related to https://github.com/matplotlib/matplotlib/issues/7413 ### Bug report Example: ```py %pylab x = randn(1000) / 1e5 y = randn(1000) / 1e5 scatter(x, y) ``` produces this:  It should really produce something more like this:  There's not an obvious way to do this, other than manually getting the min/max x and y values and adding a little bit and using `ax.set_x/ylim()` Using conda on kubuntu: ``` matplotlib 2.1.0 py36hba5de38_0 python 3.6.3 h0ef2715_3 ```