-
-
Notifications
You must be signed in to change notification settings - Fork 7.9k
Open
Labels
Documentation: examplesfiles in galleries/examplesfiles in galleries/examples
Description
Bug summary
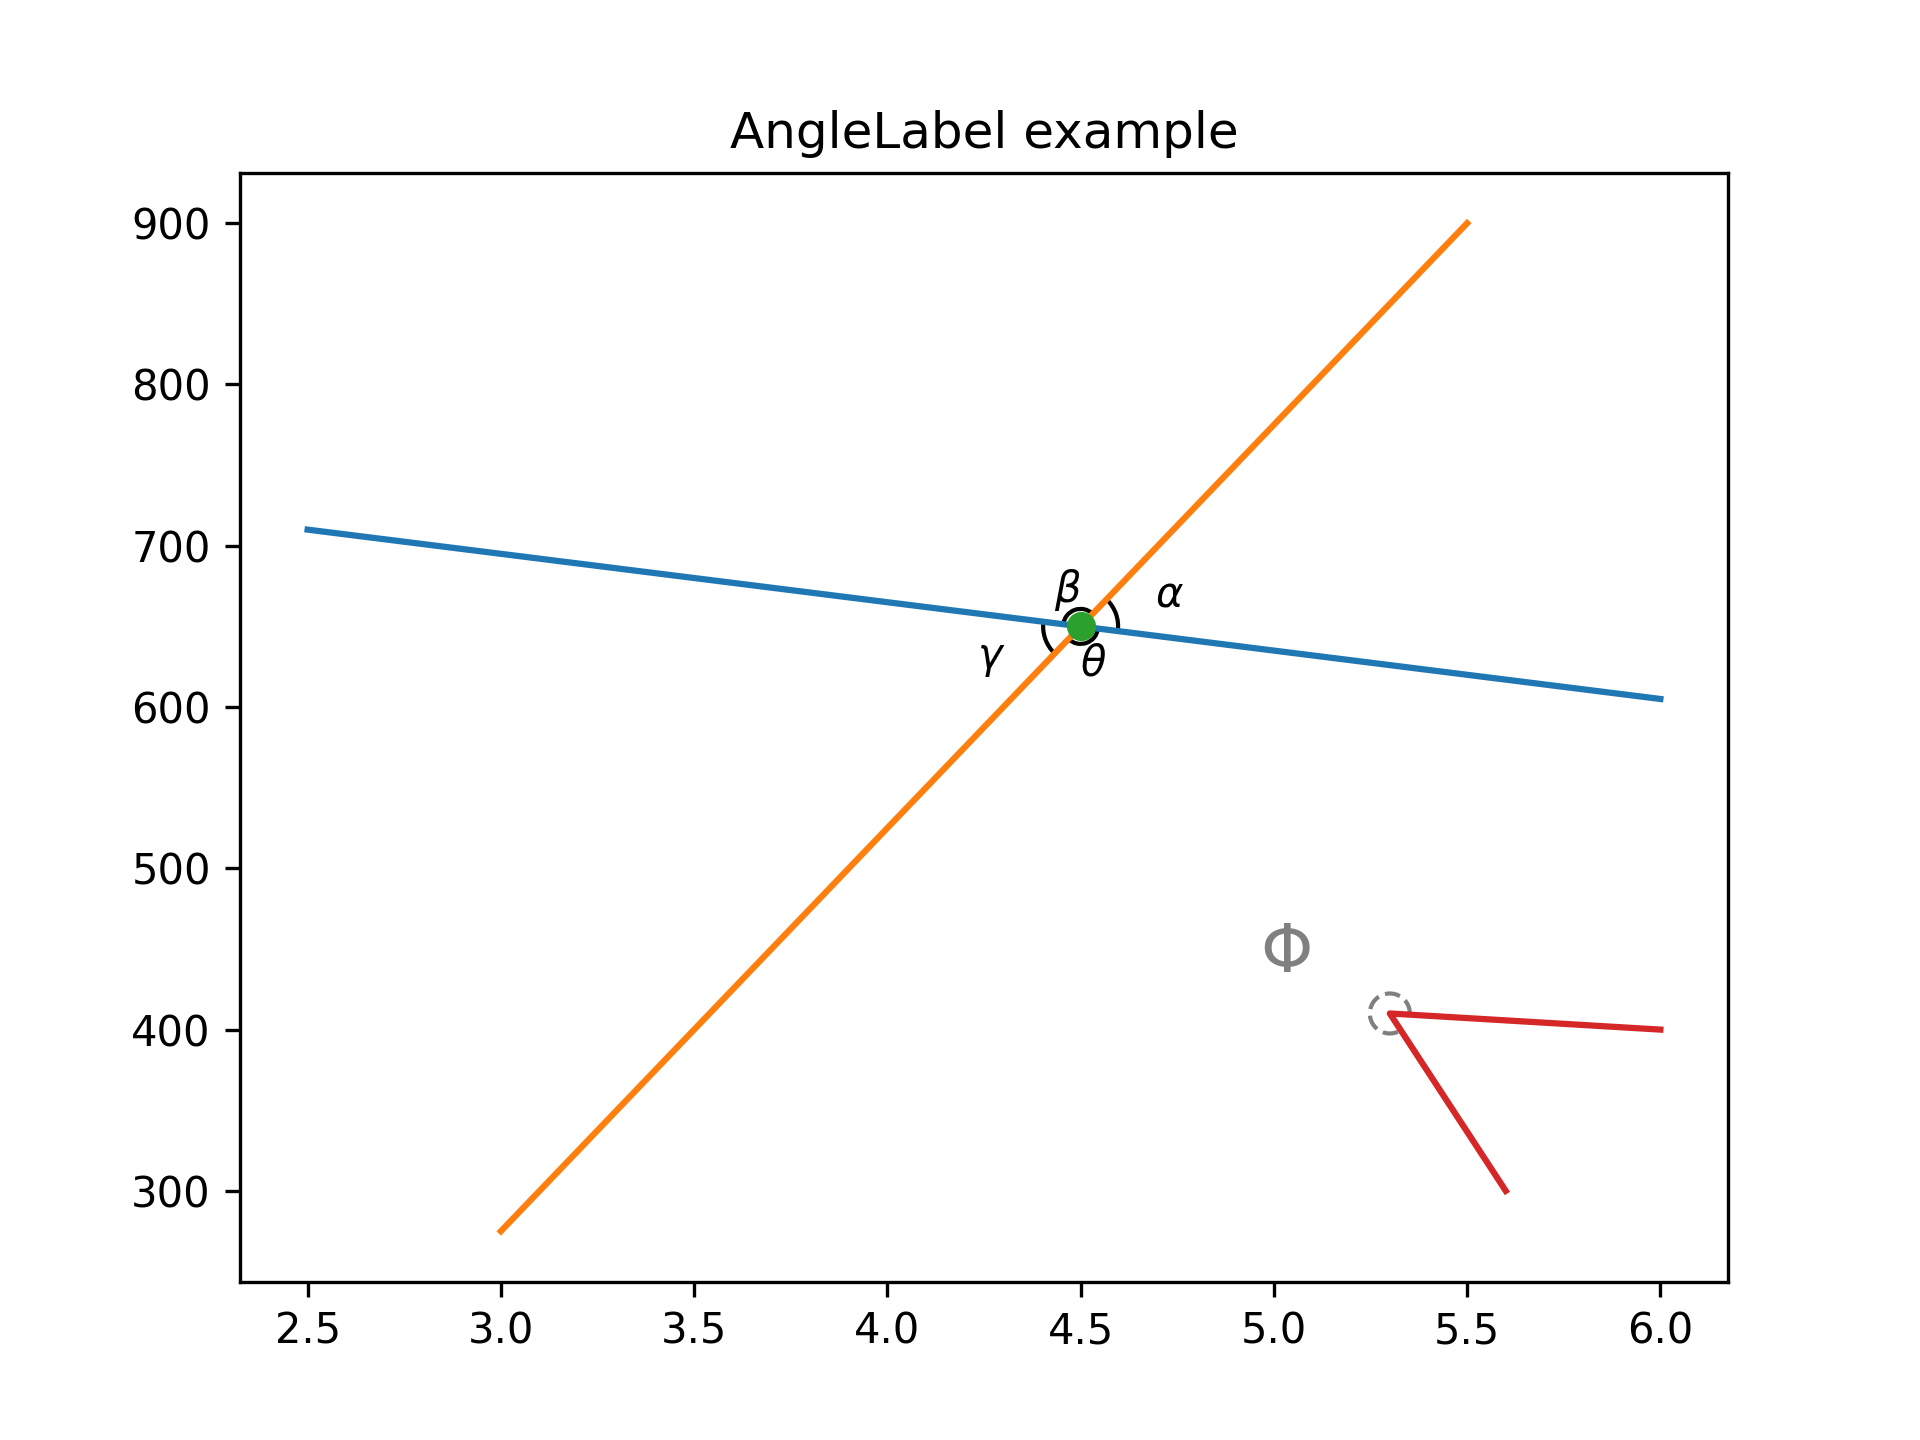
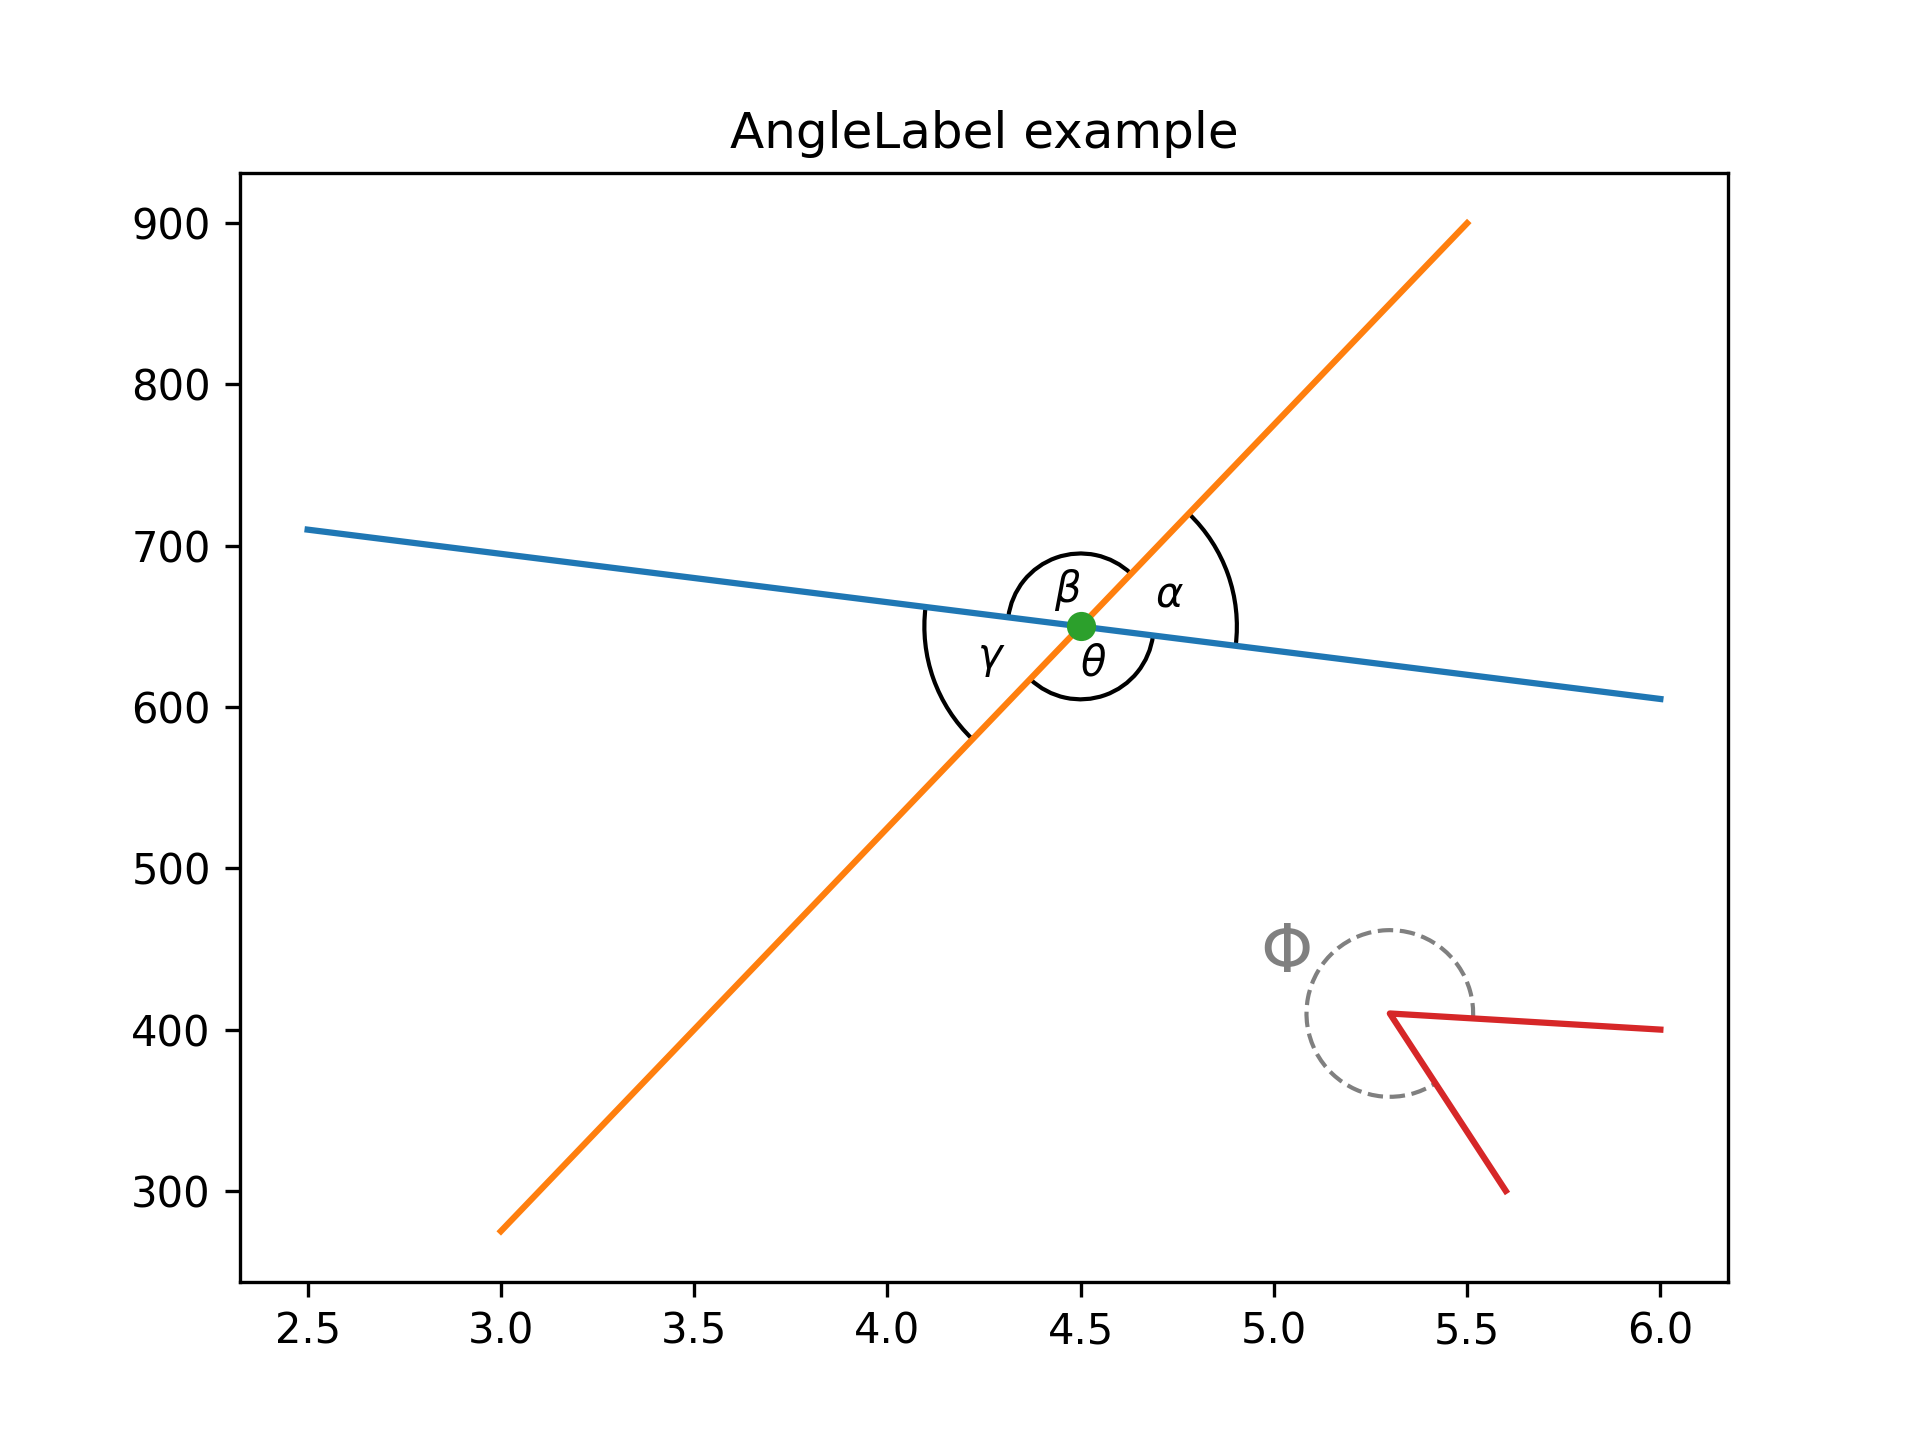
When setting a dpi value and using unit = 'points' in the AngleAnnotation example class, it does not scale the Arc width and height correctly. I will use the example from the link above to show the problem:
Code for reproduction
fig, ax = plt.subplots(dpi=300)
fig.canvas.draw()  # Need to draw the figure to define renderer
ax.set_title("AngleLabel example")

# Plot two crossing lines and label each angle between them with the above
# ``AngleAnnotation`` tool.
center = (4.5, 650)
p1 = [(2.5, 710), (6.0, 605)]
p2 = [(3.0, 275), (5.5, 900)]
line1, = ax.plot(*zip(*p1))
line2, = ax.plot(*zip(*p2))
point, = ax.plot(*center, marker="o")

am1 = AngleAnnotation(center, p1[1], p2[1], ax=ax, size=75, text=r"$\alpha$")
am2 = AngleAnnotation(center, p2[1], p1[0], ax=ax, size=35, text=r"$\beta$")
am3 = AngleAnnotation(center, p1[0], p2[0], ax=ax, size=75, text=r"$\gamma$")
am4 = AngleAnnotation(center, p2[0], p1[1], ax=ax, size=35, text=r"$\theta$")


# Showcase some styling options for the angle arc, as well as the text.
p = [(6.0, 400), (5.3, 410), (5.6, 300)]
ax.plot(*zip(*p))
am5 = AngleAnnotation(p[1], p[0], p[2], ax=ax, size=40, text=r"$\Phi$",
                      linestyle="--", color="gray", textposition="outside",
                      text_kw=dict(fontsize=16, color="gray"))
plt.show()
Actual outcome
Expected outcome
The expected outcome can be produced when changing size to get_size() in the Arc initialisation.
super().__init__(self._xydata, self.get_size(), self.get_size(), angle=0.0,
                 theta1=self.theta1, theta2=self.theta2, **kwargs)
Additional information
No response
Operating system
No response
Matplotlib Version
3.5.1
Matplotlib Backend
No response
Python version
No response
Jupyter version
No response
Installation
No response
Metadata
Metadata
Assignees
Labels
Documentation: examplesfiles in galleries/examplesfiles in galleries/examples

