-
-
Notifications
You must be signed in to change notification settings - Fork 7.9k
Closed
Labels
Milestone
Description
Bug report
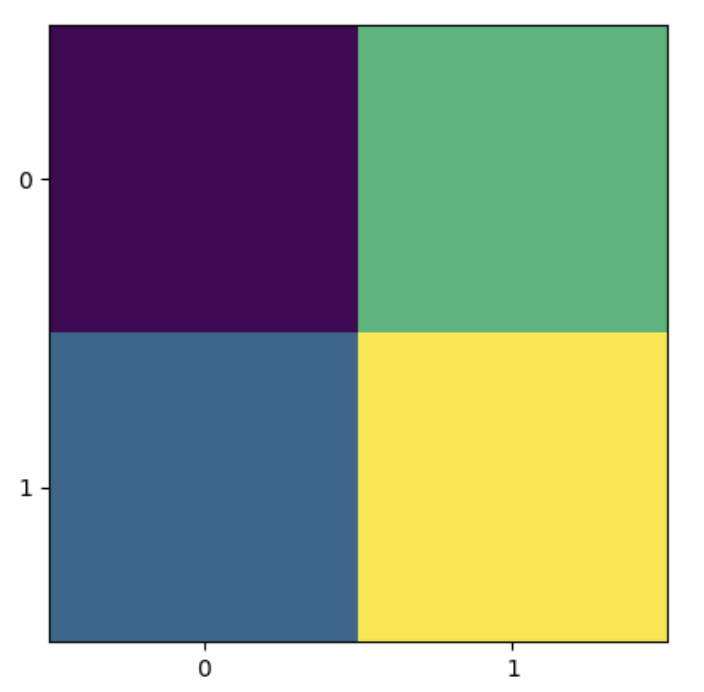
I'm using imshow, and between 3.1.0 and 3.1.1 the behavior of the extents of the plot has changed when using Axes.set_yticks. In 3.1.0, and in 3.1.1 when not calling set_yticks, the plot includes the outer 0.5 bin in the top and bottom rows. This is the desired behavior. But in 3.1.1 when using set_yticks, the outer 0.5 bin in the top and bottom rows is not included in the plot.
Code for reproduction
import matplotlib
import matplotlib.pyplot as plt

xy = [[1, 3], [2, 4]]
fig, ax = matplotlib.pyplot.subplots(1)
ax.imshow(xy)
ax.set_xticks([0, 1])
ax.set_xticklabels(["0", "1"])
ax.set_yticks([0, 1])
ax.set_yticklabels(["0", "1"])
fig.savefig(f"matplotlib-v{matplotlib.__version__}.png")
The behavior changes in 3.1.1 if ax.set_yticks([0, 1]) is commented out.
Behavior in 3.1.1 with set_yticks

Matplotlib version
- Operating system: Mac OS 10.14.5
- Matplotlib version: 3.1.1
- Matplotlib backend: agg
- Python version: 3.7.3
- Jupyter version (if applicable): N/A
- Other libraries: Fresh conda install of just matplotlib, using conda-forge
