-
-
Notifications
You must be signed in to change notification settings - Fork 96
Description
As I mentioned in #14 (comment):
[...] It'd be useful to see how long individual components took to render. Both 1. including any child components and 2. excluding child components.
However, the problem there is how and where to show the results. I'd prolly make most sense using the django-debug-toolbar, e.g. forking / taking inspo from the template-timings.
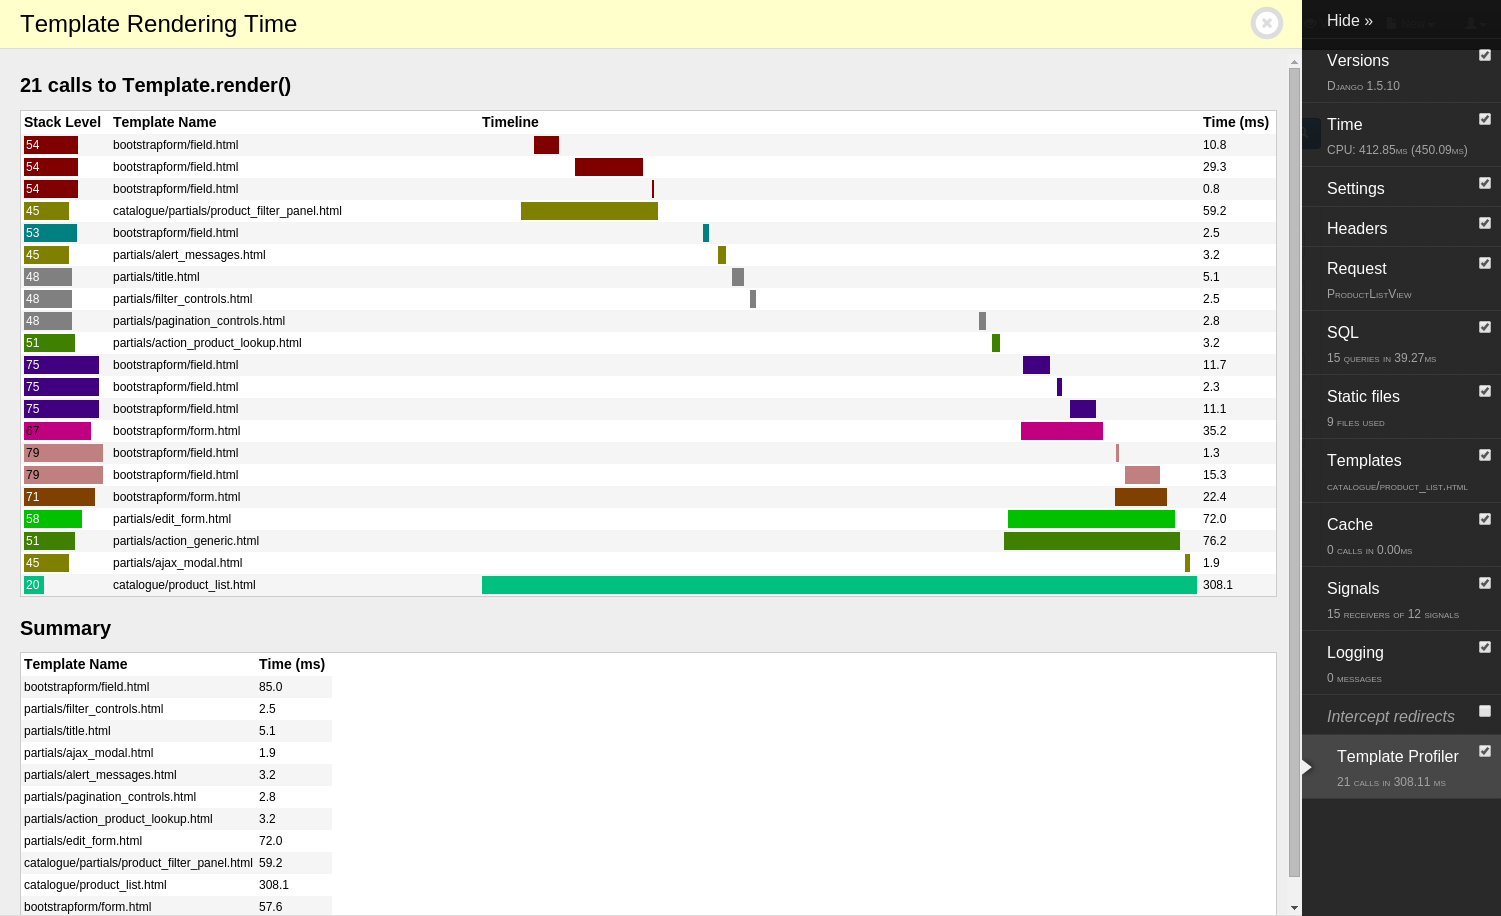
I had a look at how https://github.com/node13h/django-debug-toolbar-template-profiler is implemeneted, and it's actually really simple.
We could take similar approach as them, but with more detailed resolution. As mentioned above, it'd be good to include:
- Component render time INCLUDING any child components
- Component render time EXCLUDING any child components
A single component tree may contain the same component rendered at multiple places, and these should be distinguishable. So each component should also include its ID and component tree path (e.g. "MyPage > MyLayout > Info > Button > Button(slot:content)").
Moreover, I thnk it'd be useful to see the time taken also for the hooks / methods that we allow to override - get_context_data, get_js_data, get_css_data, on_render_before, on_render_before (and IMO there should be also on_render, but that's for another discussion for later).
So when you consider the graph from template profiler, then I think we could have that, BUT:
- Each entry would be a Component instance, not a template
- Instead of "stack level", we'd have the component tree path
- Maybe the data could be actually shown as a treeview(?)
- One could click on the Component row to show / hide detailed render times, which would include:
- Time it took to render the template (minus any nested components)
- Time spent in
get_context_data - In
get_js_data get_css_dataon_render_beforeon_render_before- Maybe also time taken for individual slots?
Implementation
Implementation is also fairly simple:
- We'd wrap the template rendering and relevant and measure time taken (only if enabled).
- To connect into django-debug-toolbar, we'd subclass their Panel class. This subclass is then instantiated by django-debug-toolbar, passing in the http request.
- We'd define a custom internal Signal. We'd send events to this signal like the time taken to render component / slot, etc.
- Our Panel subclass would start listening to the signal on initialization, and it store the data. This way the Panel instance would collect data throughout the rendering.
- On the Panel class there's a method that's called when django-debug-toolbar wants to render the page. Here we'd access the collected data and visualize it.---
So I think the only question is what would be a good design to show the recorded data.
Personally I think it'd make sense for this to live under the django-components org.
